In the spotlight

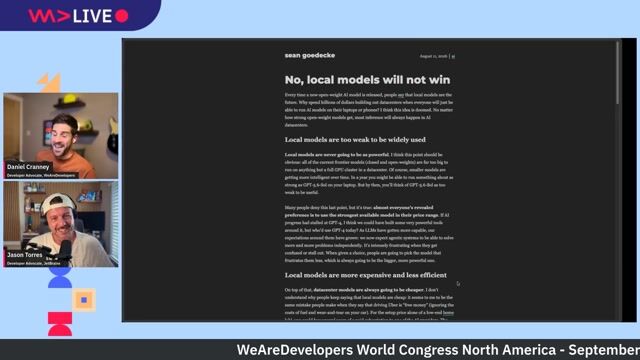
WeAreDevelopers LIVE - Project Chopin: Make Your Team and Agents Play Along1:21:17

WeAreDevelopers LIVE - Project Chopin: Make Your Team and Agents Play Along

Chris Heilmann, Daniel Cranney & Krzysztof Cieślak • WeAreDevelopers LIVE

On this week’s show we’re joined by GitHub Next’s Krzysztof Cieślak to talk about his project Chopin, and how it helps teams and agents work together.

Community Members

The world’s leading events for developers and tech leaders

Three continents. Thousands of developers and tech experts. One community. Experience the latest in modern software development – where the focus is on people, on developers, on you.

Become a sponsor
WeAreDevelopers is my favorite conference. It's the best event you can go to if you are a developer!
Joel Spolsky
Joel Spolsky
Founder of Stack Overflow
Hard to believe! This is the largest group I've ever been in front of. Honoured to be here. All the people I'm meeting just remind me of myself!
Steve Wozniak
Steve Wozniak
Co-founder of Apple
WeAreDevelopers is the place where you meet everyone else in the industry and learn about the latest things.
David Singleton
David Singleton
CTO at Stripe

Latest career opportunities

View all jobs
C++ Developer

thinkcell
Berlin, Germany

90-130K
Intermediate
Senior
C++

Inside tech companies

View all companies

SciChart

London, United Kingdom

How to Visualize Millions of Data Points Without Slowing Down Your Dashboard: 5 Steps

Every dashboard looks fast until it isn't.

Ten thousand rows, no problem. Then someone loads a full trading day, or a season of sensor data, and the browser tab just stalls. No error, no crash. It just stops feeling real time.

This isn't bad luck. It's architecture.

Most charting libraries were built around the DOM, not the GPU. SVG charts turn every data point into its own element, and the browser has to track all of them, so performance drops off once you're into the thousands. Canvas is a step up. It draws pixels directly instead of managing DOM nodes, which is why it comfortably handles tens of thousands of points. But it still runs on the main thread, so once you're animating hundreds of thousands of rows at once, the CPU becomes the bottleneck.

WebGL is the real shift. It hands drawing to the GPU, which renders in parallel instead of one point at a time. That's the difference between a chart that chokes at 10,000 points and one that stays smooth well past a million.

But raw rendering power only gets you so far. The libraries that hold up under real datasets combine it with two other techniques. Downsampling algorithms like LTTB reduce the number of points sent to the renderer while keeping every spike and sharp turn intact, so the shape of the data never gets flattened out. Level of detail rendering does the rest, keeping zoomed-out views light and letting zoomed-in views sharpen automatically, so nothing feels sluggish at any zoom level.

Server-side aggregation can help too, but it's easy to overstate what it actually solves. It reduces what crosses the network. It doesn't touch what the browser has to draw once the data lands. That part is still, and always will be, a rendering problem.

This is the exact challenge our engineers at SciChart work on daily, building for financial, medical and industrial applications where a stalled chart isn't just annoying, it's a lost trade or a missed reading. It's also why we've pushed SciChart.js far enough to test rendering a billion points in-browser without the dashboard turning into a slideshow.

Full breakdown here: https://www.scichart.com/blog/how-to-visualize-millions-of-data-points-efficiently/

SciChart

Riverty

Berlin, Germany

Do we tick your boxes?

𝗘𝘃𝗲𝗿𝘆𝗼𝗻𝗲 𝗵𝗮𝘀 𝗮 𝗰𝗵𝗲𝗰𝗸𝗹𝗶𝘀𝘁 𝘄𝗵𝗲𝗻 𝗹𝗼𝗼𝗸𝗶𝗻𝗴 𝗳𝗼𝗿 𝗮 𝗻𝗲𝘄 𝗷𝗼𝗯.

The title matters, but so do the people. The purpose. The flexibility. The feeling that you belong.

But what does that actually look like?

Here’s what many jobseekers are looking for today:
✅ Work-life balance
✅ Stability and long-term growth
✅ A company with purpose and global reach
✅ Tech that drives innovation in finance
✅ Friendly people who care
✅ Grow and learn new things

Maybe this list looks like yours? See how yours might begin at Riverty too.

Riverty

Berlin, Germany

Shaping Riverty's AI Journey: Senior AI Tech Consultant at Riverty | Regina Gerber (Verl)

Regina Gerber has played a key role in growing Riverty's AI team and shaping the company's technological direction.

When Riverty began accelerating its AI journey, Regina was already thinking one step ahead. Based in Verl, Germany, Regina joined three years ago through her Bertelsmann network, motivated by the chance to build something from the ground up. Today, as Senior AI Tech Consultant, she plays a key role in shaping Riverty’s technological direction while continuing to shape her own career.


Read her full story

Riverty

Sopra Steria Custom Software Solutions GmbH

München, Germany

Vom Entwickler zum Architekten der KI: Warum Agentic Engineering die Spielregeln verändert

Was passiert, wenn KI nicht mehr nur einzelne Aufgaben unterstützt, sondern ganze Prozesse übernimmt? Genau darum geht es in dem Vortrag von Per Schulte über Agentic Engineering.

Die zentrale Idee: Die Zukunft gehört nicht denen, die einzelne Features bauen. Sie gehört denen, die Systeme entwickeln, die Features eigenständig erschaffen. KI-Agenten analysieren Anforderungen, erstellen Konzepte, schreiben Code, testen Anwendungen und unterstützen sogar Marketing und Wachstum. Der Mensch bleibt dabei unverzichtbar, aber seine Rolle verändert sich grundlegend. Er wird vom Ausführenden zum Architekten und Orchestrator intelligenter Systeme.

Für Entwicklerinnen und Entwickler bedeutet das eine spannende Chance: Statt repetitive Aufgaben zu erledigen, können sie sich stärker auf Strategie, Kreativität und die Gestaltung komplexer Lösungen konzentrieren. Agentic Engineering zeigt, wie Mensch und KI gemeinsam digitale Produkte schneller, intelligenter und wirkungsvoller entwickeln können.

Unser Fazit: Die nächste Generation von Engineering dreht sich nicht nur um besseren Code. Es geht darum, intelligente Systeme zu schaffen, die ganze Wertschöpfungsketten unterstützen. Wer diese Entwicklung versteht, gestaltet die Zukunft der Softwareentwicklung aktiv mit. 🚀

piazza blu² GmbH

Köln, Germany

Was Mitarbeiter sagen

»Als Entwickler kann man sich hier voll und ganz mit den modernsten Technologien auseinandersetzen. Dank unkomplizierter Arbeitsabläufe können wir uns effizient auf unsere Aufgaben konzentrieren, und bei Fragen finden wir gemeinsam schnelle Lösungen – alle sind hilfsbereit und arbeiten zielorientiert zusammen.« 

https://www.piazzablu.com/karriere

piazza blu² GmbH
Chris Heilmann
The Geometry of Incidents: Connecting User Impact to Architecture
This is a guest post by Bala Subrahmanyam Kambala , a Staff Platform Engineer at Oracle Cloud Infrastructure (also check out his blog ). He is one of our speakers at the WeAreDevelopers World Congress North America and will present on Friday, the 25...
The Geometry of Incidents: Connecting User Impact to Architecture
Daniel Cranney
Dev Digest 237: 20 years of jQuery, Claude's Tools & Safest Job in AI!
Inside last week’s Dev Digest 237 . 🤖 Are you suffering from ‘model fatigue’? 🔐 How AI builders will get hacked 🕰️ Twenty years of jQuery 🔍 Check if a file was made with Claude 🎮 Chopin – a real-time multiplayer, agentic planning environment 🌍 The t...
Dev Digest 237: 20 years of jQuery, Claude's Tools & Safest Job in AI!