How to Visualize Millions of Data Points Without Slowing Down Your Dashboard: 5 Steps
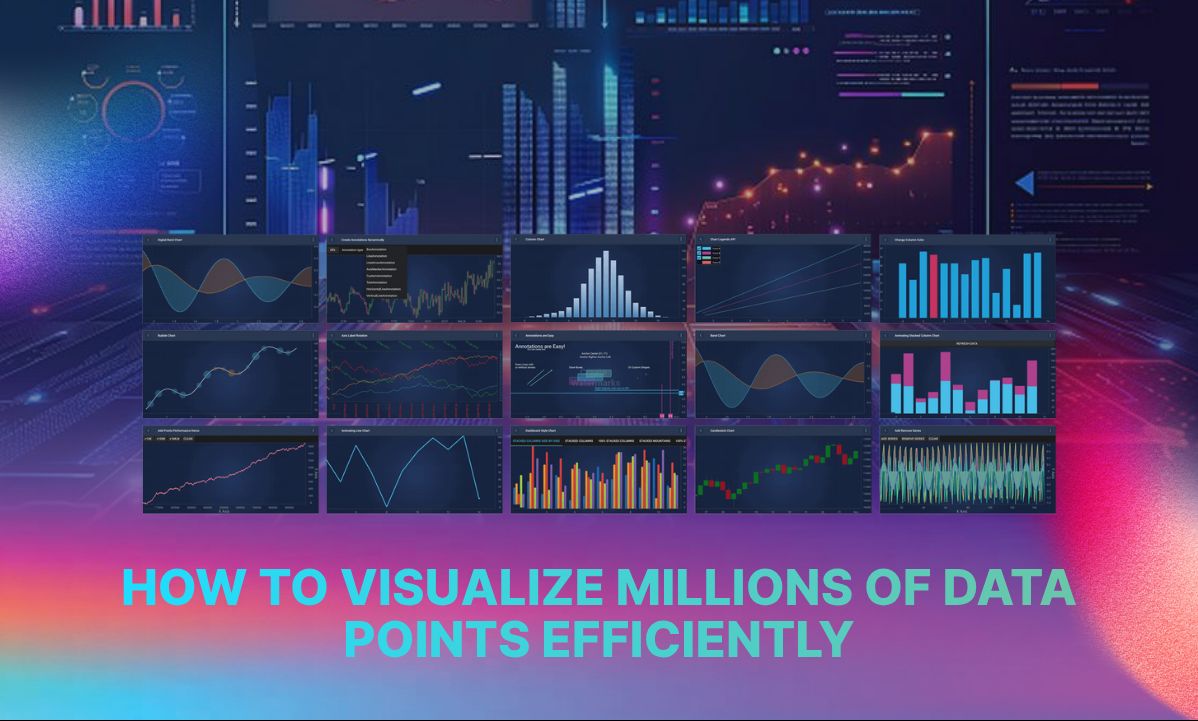
Every dashboard looks fast until it isn't.
Ten thousand rows, no problem. Then someone loads a full trading day, or a season of sensor data, and the browser tab just stalls. No error, no crash. It just stops feeling real time.
This isn't bad luck. It's architecture.
Most charting libraries were built around the DOM, not the GPU. SVG charts turn every data point into its own element, and the browser has to track all of them, so performance drops off once you're into the thousands. Canvas is a step up. It draws pixels directly instead of managing DOM nodes, which is why it comfortably handles tens of thousands of points. But it still runs on the main thread, so once you're animating hundreds of thousands of rows at once, the CPU becomes the bottleneck.
WebGL is the real shift. It hands drawing to the GPU, which renders in parallel instead of one point at a time. That's the difference between a chart that chokes at 10,000 points and one that stays smooth well past a million.
But raw rendering power only gets you so far. The libraries that hold up under real datasets combine it with two other techniques. Downsampling algorithms like LTTB reduce the number of points sent to the renderer while keeping every spike and sharp turn intact, so the shape of the data never gets flattened out. Level of detail rendering does the rest, keeping zoomed-out views light and letting zoomed-in views sharpen automatically, so nothing feels sluggish at any zoom level.
Server-side aggregation can help too, but it's easy to overstate what it actually solves. It reduces what crosses the network. It doesn't touch what the browser has to draw once the data lands. That part is still, and always will be, a rendering problem.
This is the exact challenge our engineers at SciChart work on daily, building for financial, medical and industrial applications where a stalled chart isn't just annoying, it's a lost trade or a missed reading. It's also why we've pushed SciChart.js far enough to test rendering a billion points in-browser without the dashboard turning into a slideshow.
Full breakdown here: https://www.scichart.com/blog/how-to-visualize-millions-of-data-points-efficiently/